Thanks for tuning in to Flexibility is Freedom!
This month, I earned a little pocket change from Amazon Associates which was quite motivating.
I also have some preliminary data now on this business model and I discuss my findings (and an illustrative example) in the section on Key Metrics.
But first, I'll recap my progress in March.
As I mentioned last month, I've decided to focus on link building for the next few months. This is something I absolutely need to get better at if I want to be successful in online marketing.
My game plan is to launch an expanded email outreach campaign for my post on acne scars.
This month, I completely revised and redesigned my ultimate guide on acne scars. I'm now working with a designer on Fiverr to create custom images for this article.
After that, I might also commission an infographic to make this article even better (more shareable, can post it on Pinterest, and it helps for link building as well).
Nothing else to report for March. I was in Cuba for a solid week and had some nice R&R.
Now, I'll walk through the key metrics for my site.
Here are the key metrics for my authority site (The Derm Detective) for the last 3 months.
Data Sources: Google Search Console, Amazon Associates
Doing some simple math, we can evaluate a few additional metrics.
Alright, so what does this all mean?
Before drawing any conclusions or insights, I should note that the data is still very limited (recall that my site was started back in Nov 2018).
But it does provides my first glimpse into some hard data on this business model. When I first started, I relied heavily on "napkin math" and assumptions to evaluate this type of business.
Now, I can (sort of) validate those assumptions and calibrate my expectations.
For example, one of the questions that I often think about is,
"What level of traffic do I need to create $1,000 of revenue per month?"
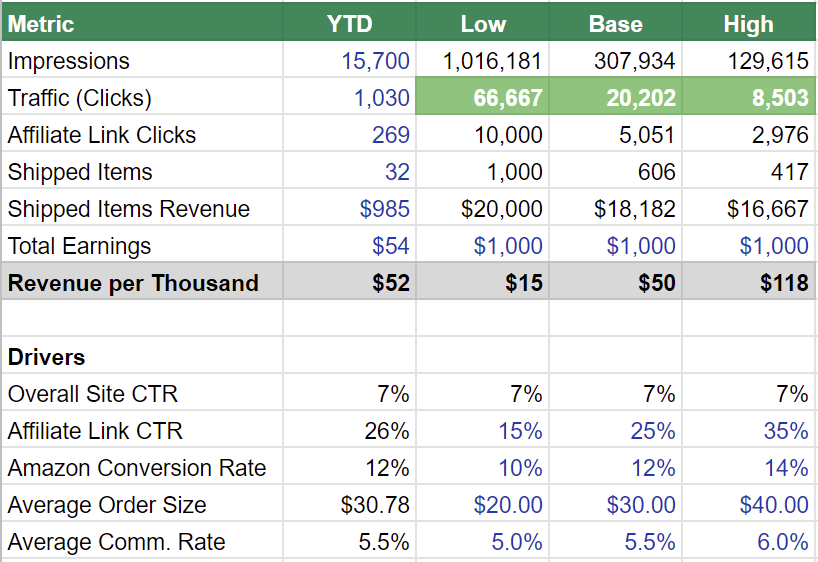
Well, true to my previous life as a financial analyst, I've prepared a very simple model to answer that exact question. I've included the key metrics and created 3 hypothetical scenarios.
In the base case, I assume similar metrics to what I'm seeing today in the data.
In the low and high cases, I make a few adjustments to the downside and upside, respectively.
Here are the results:

In this model, I'm trying to solve for monthly traffic (shaded in green) by setting total earnings to $1,000 per month.
Under a base case, I'd need around 20K monthly traffic to achieve this result. If my assumptions turn out to be too aggressive, I may need up to 60K+ to achieve the same earnings. And if there's any upside to my assumptions, perhaps I only need 8K or so of monthly traffic.
UPDATE 2021: fast forward 2+ years and my business is tracking towards the Upside Case where I'm able to earn $1,000+ per month with only 10-12K sessions (visitors).
Since there's a lot of moving pieces in the "Drivers" section, one easy way to sum up these changes is with Revenue per Thousand (RPM).
Under a base case, RPM is around $50. In the low case, RPM is less than one-third of that, and in the high case, it's more than double that.
UPDATE 2021: RPMs averaged from $80-$120+ since July 2020, reflecting the higher profitability (EPC) of non-Amazon affiliate programs, following Amazon Associates's April 2020 rate cut.
RPM is essentially an indicator of profitability:
The last step is to evaluate the required traffic with competitors to assess if this is do-able.
In some ways, I think of this business as having two main drivers:
In April, my game plan is to:
To Flexibility and Freedom,
Tom