
Happy Canada Day! 🍁 And welcome back to Flexibility Is Freedom!
Believe it or not, but it's been 3 years since I began building passive income!
Honestly, it feels more like 5 years (or forever), especially with the last 1.5 years of COVID-19, but we don't get to choose the time we live in, only how we live with the time we're given.
Now, I've done a lot of reflection about my journey, on both a personal and professional level, and while there's certainly been up's and down's along the way, I'm extremely glad that I made the difficult decision to pursue this opportunity & lifestyle.
Whenever I feel lost (which happens very often) or without a sense of purpose, I always re-read my original post on Medium, 5 Reasons I Quit My Job to Build Passive Income Businesses, and periodically review my income reports on Flexibility Is Freedom as well to remind myself of both how far I've come and the inspirations that I've found along the way.
In a few days, I'll be publishing a full blog post about my 3-year journey!
RELATED: 3-Year Review
I'll discuss business results and activities, what's worked & what hasn't, my personal experience running an online business, and the associated lifestyle possibilities.
For now, though, sit back and enjoy my June 2021 income report! April and May were both short and sweet, so I definitely owe you guys a longer one to wrap up Q2 2021.
Revenue and sessions rebounded for the first time since the December 2020 Core Update. 😎
While sessions increased significantly by +70% MoM, it was a massive jump in profitability (RPM) to $194 that really drove the explosive revenue increase of +280% MoM.
I think the main drivers were my content optimization efforts (which started in April 2021) as well as more strategic decisions on keyword research & content management.
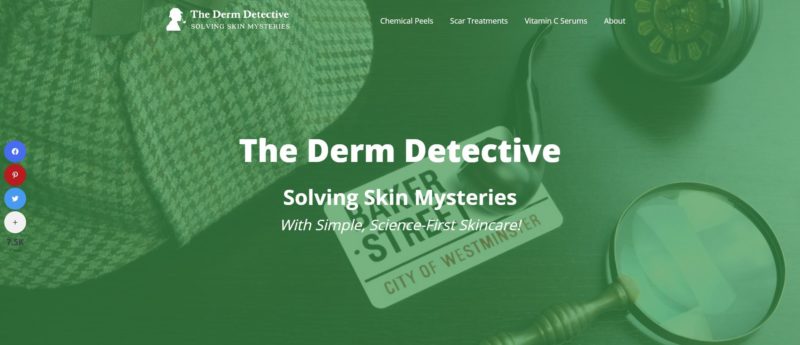
In Q1 2021, I took time away from my main business to explore new business opportunities as part of my long-term diversification strategy, including 1 joint venture with a friend.
In Q2 2021, I completely rebuilt the website from the ground up using Oxygen Builder, optimized the technology stack, and upgraded my analytics dashboards.
With that in mind, I'm happy with these initial results, perhaps a sign of further things to come as I continue to create SEO-optimized content.
I completely redesigned the website to run faster and cheaper than before:
At this point, I've spent over $6,000 on SaaS and Lifetime software. Not every purchase was useful (many are sitting on the shelf after I bought them on AppSumo), but I now have just about everything I need for the next 3-5 years.
In the past, I've always talked about content optimization and content quality but I've never been able to "measure" it objectively. Until now...
Today, I use 3 tools to calculate a Topic Score and provide content recommendations:
Each tool uses a slightly different methodology to evaluate the relevancy of a piece of content and I like to combine their recommendations (along with human judgment) to craft the best article.
These recommendations include:
To stay organized, I keep track of all my content's Topic Scores in a content dashboard.
Starting Q2 2021, I've started to systematically catalogue my content and significant keywords into a content dashboard that includes the following:
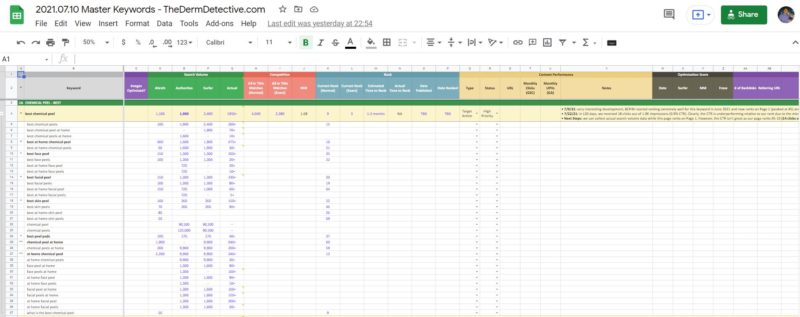
Overall, this content dashboard combines what would have been 2-3 separate spreadsheets - making it easier to conduct analysis and make decisions at every stage of the content lifecycle:
Finally, I created URL reports in Google Data Studio to visualize data from Google Search Console and Google Analytics - resulting in quick & easy analysis of individual URL performance.
In the past, I spent hours and hours on manual reports and ad hoc analysis so it was definitely worth the upfront investment to learn to use Google Data Studio.
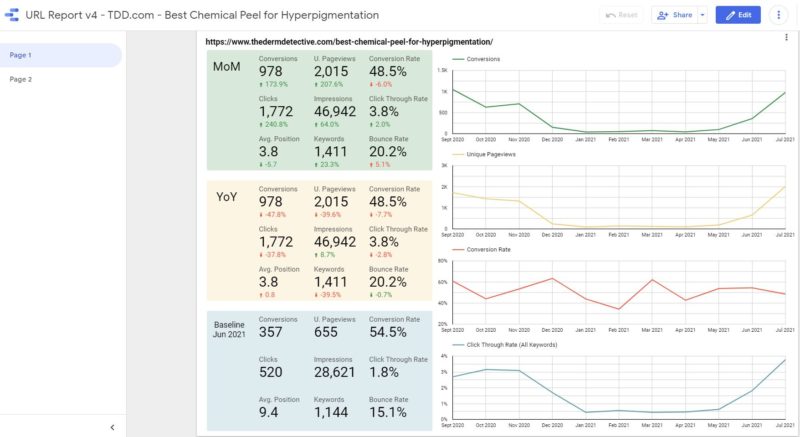
The URL report tracks the following Key Performance Indicators (KPIs):
On the backside side, I bought a guest post from LinkGraph to test out their service but decided not to pursue a long-term commitment due to the quality of the first one.
My short-term plan is to continue recycling monthly cash flow into backlink acquisitions.
Thanks for reading my June 2021 income report! As I mentioned, I'll have more details to share in my 3-year review where I'll walk through my business results, activities, and personal experience.
To Flexibility and Freedom,
Tom